Pranav Rane
Computer vision for double cantilever beam tests
Background
Double Cantilever Beam (DCB) tests are a fundamental method used in the field of materials science and engineering to evaluate the fracture toughness of adhesive joints, composite materials, and other bonded structures. This test is particularly significant in assessing the resistance to crack growth under mode I loading, where the crack faces are pulled apart perpendicular to the crack front.
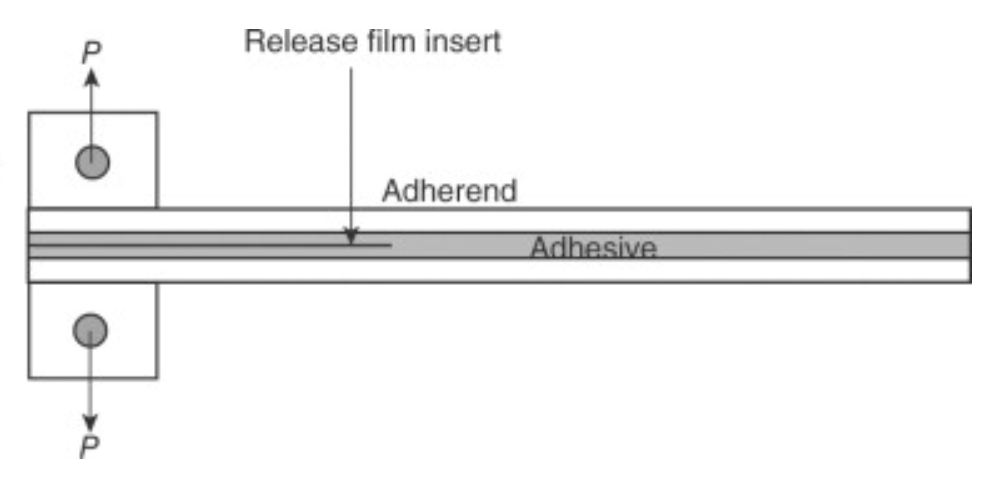
The DCB test involves a specimen that typically consists of two arms bonded together along a plane with an initial crack or pre-crack. The specimen is subjected to a tensile load applied at the ends of the arms, causing the crack to propagate (Figure 1). The critical parameters of the test include the load, displacement, and crack length, which are used to calculate the mode I fracture toughness, \(G_{I}c\).

The mode I fracture toughness is determined using the following relation: \begin{equation} G_{I}c = \frac{P \delta}{2Ba} \end{equation} where \(P\) is the applied load, \(\delta\) is the displacement, \(B\) is the specimen width, and \(a\) is the crack length.
DCB tests are extensively used in various industries, including aerospace, automotive, and civil engineering, due to their reliability in evaluating the performance of materials and bonded joints. In the aerospace sector, for instance, DCB tests are crucial for assessing the durability and safety of composite materials used in aircraft structures. Similarly, in the automotive industry, these tests help in the development of lightweight and strong adhesive bonds, contributing to the overall safety and efficiency of vehicles.
Methods
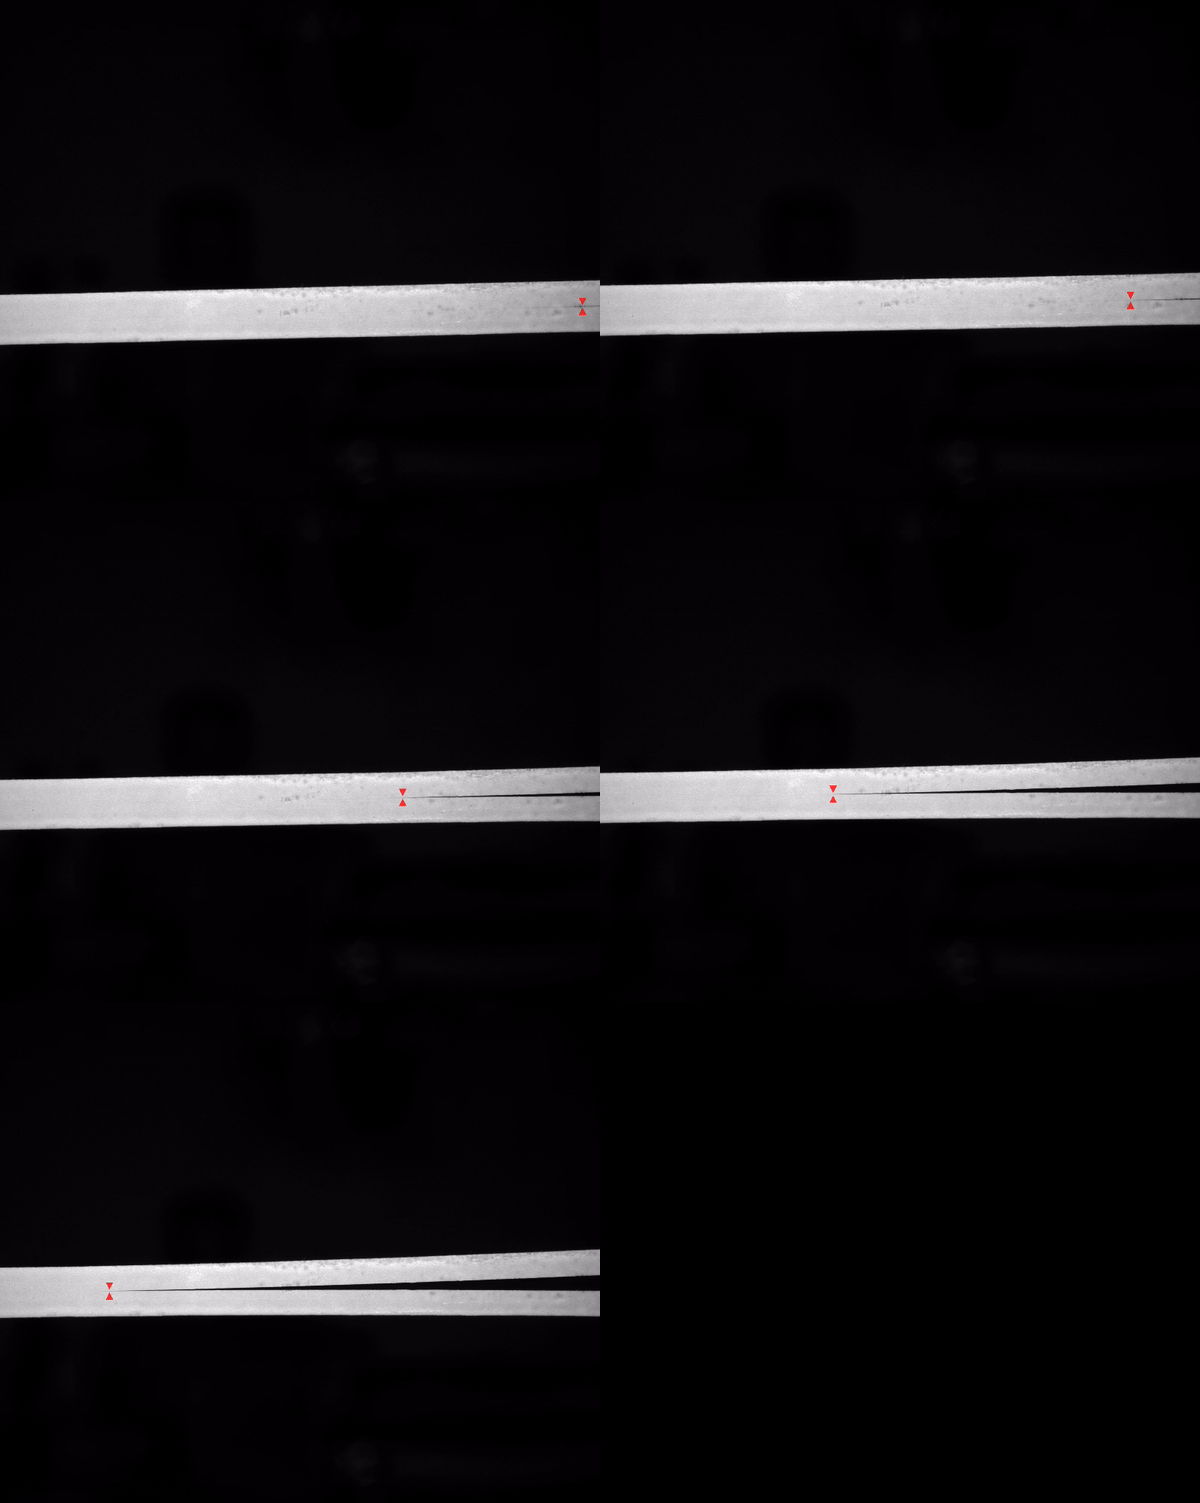
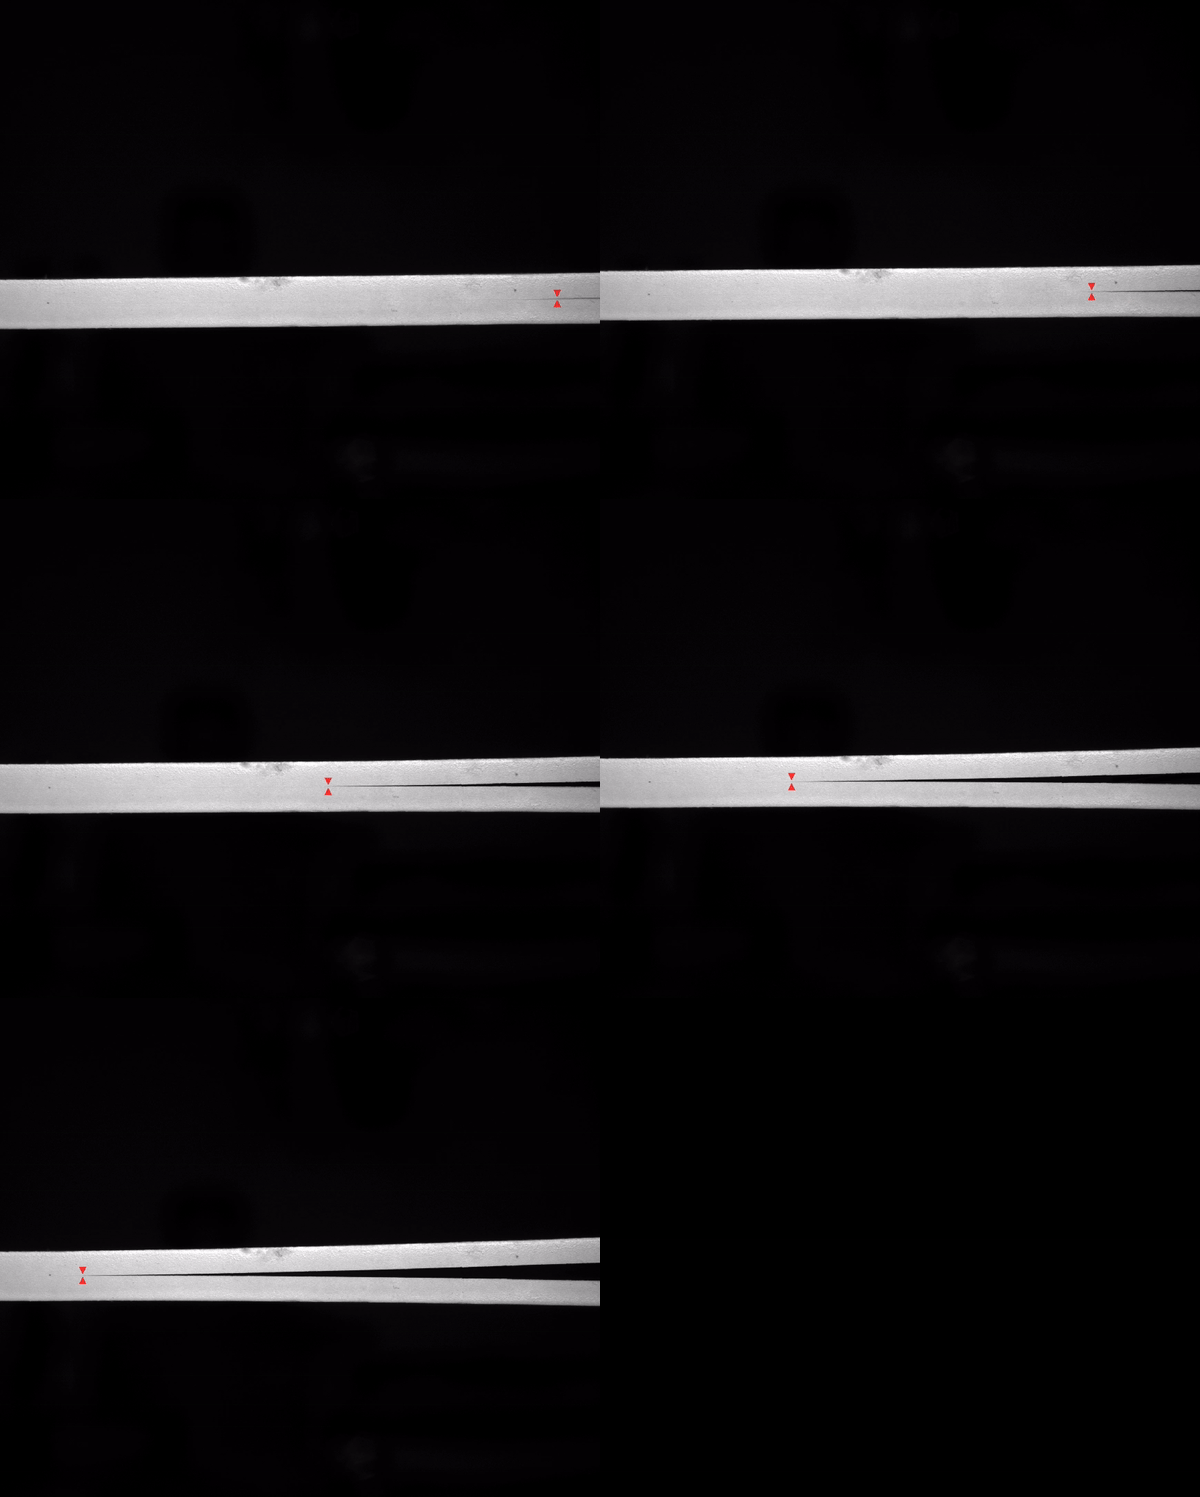
I had access to several high quality DCB test videos. I implemented code in Matlab that provided a user interface to track the crack growth as the load \(P\) was increased. The user simply had to select the initial starting crack position, and then my template matching algorithm would track the growth of the crack in each consecutive image frame.
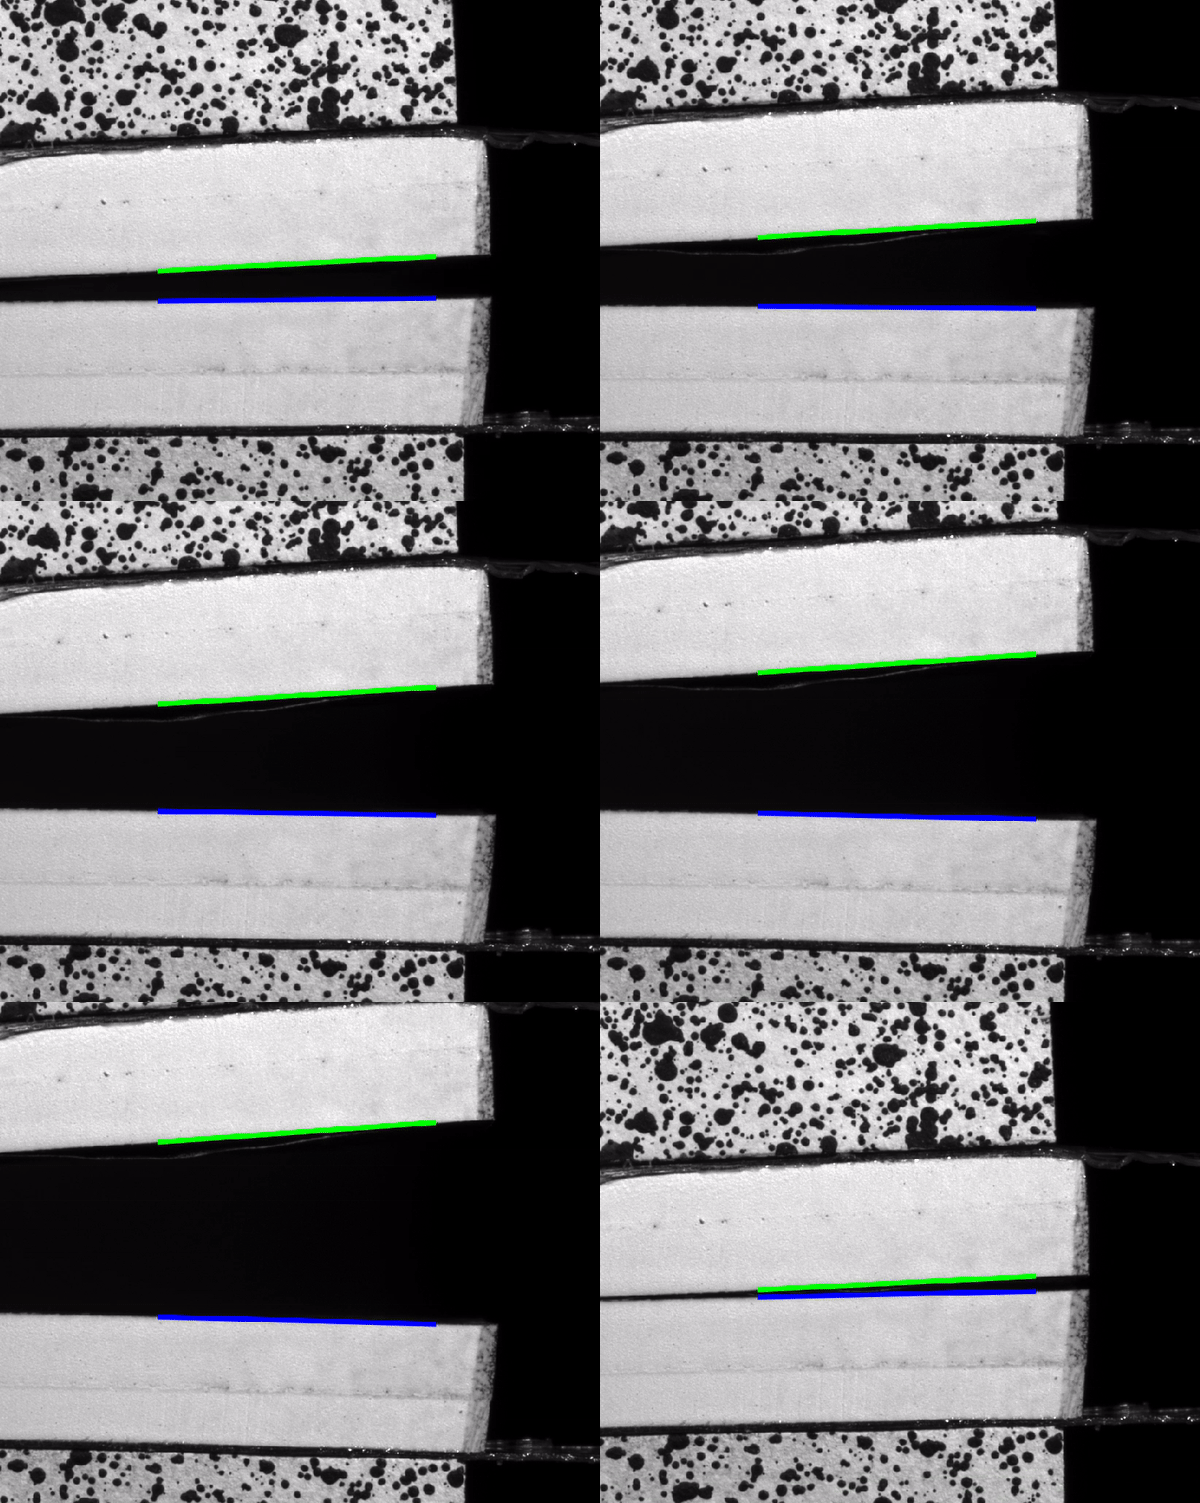
In addition to quantifying the crack length, I also wanted to automatically obtain angular data of the ends of the specimen. I implemented a gradient filter to detect the edge of the beam, and output the angle each arm made with the horizontal.
Results
The template matching algorithm provided good estimates of the location of the tip of the crack across several datasets (Figures 2-3)


The gradient filter algorithm also provided accurate angular measurements of the edges of the beam (Figure 4).

My algorithm was used to extract important parameters of the DCB test, aiding in the accuracy and efficieny of fracture analysis for materials.