Pranav Rane
3-D Structure Analysis of Fiber Reinforced Composites using convolutional neural networks
Background
Carbon fiber reinforced composites (CFRCs) are materials that have revolutionized industries from aerospace to sports equipment. These materials combine the exceptional strength and stiffness of carbon fibers with the binding properties of a polymer matrix, resulting in a composite material with an extraordinary strength-to-weight ratio.
The arrangement, or layout, of carbon fibers within a composite is paramount in determining its overall properties. This is due to the anisotropic nature of carbon fibers, meaning their properties vary depending on the direction of the applied load.
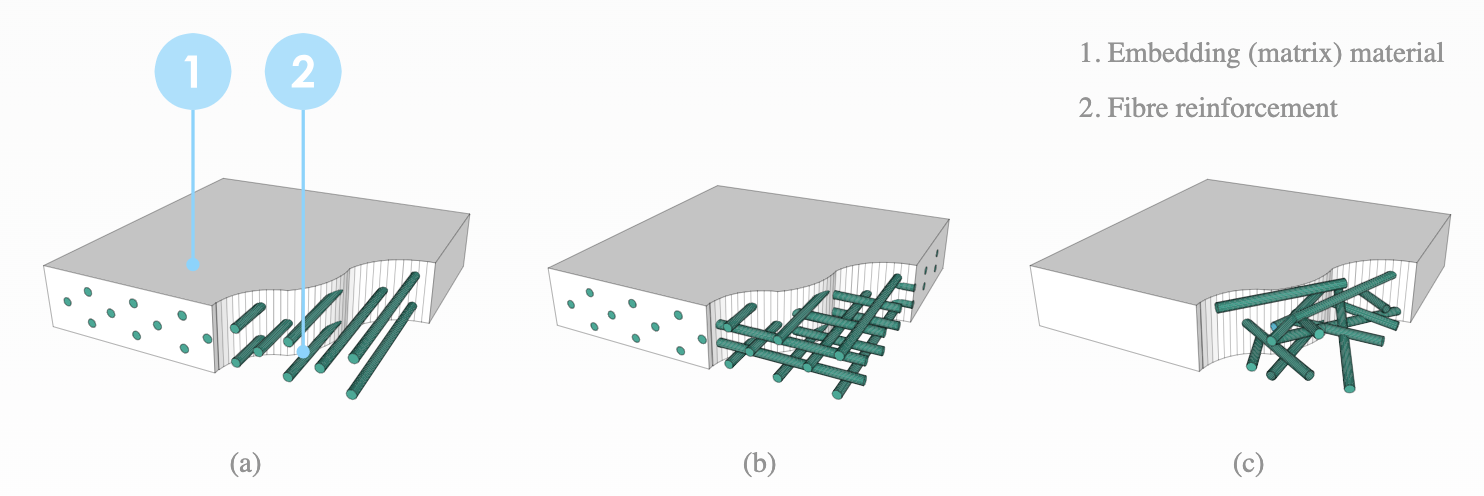
In a unidirectional layout, the configuration involves aligning all carbon fibers in a single direction (FIgure 1a). This maximizes strength and stiffness along that specific axis, making it ideal for components subjected to primarily axial loads, such as load-bearing beams or aircraft wings. However, it offers limited strength and stiffness in other directions.
In a multidirectional layout, the carbon fibers are oriented in multiple directions within a composite (FIgure 1b and 1c). This approach provides a more balanced distribution of strength and stiffness, making it suitable for components subjected to complex loading conditions, such as automotive body panels or pressure vessels.
The optimal fiber layout is crucial for maximizing the performance of a CFRC component. Incorrect fiber orientation can lead to reduced strength, stiffness, and durability, potentially compromising the component's integrity.
Fiber Layout Determination
Precisely determining the actual fiber layout within a CFRC is essential for several reasons:
- Verifying that the manufactured composite adheres to the designed fiber layout is crucial for ensuring product quality and reliability
- Understanding the fiber orientation in a failed component can provide valuable insights into the cause of failure, enabling improvements in future designs
- Real-time monitoring of fiber layout during the manufacturing process can enable process optimization and the creation of complex, high-performance components
Therefore, developing algorithms capable of accurately determining the fiber layout within a CFRC is a critical step.
Data collection
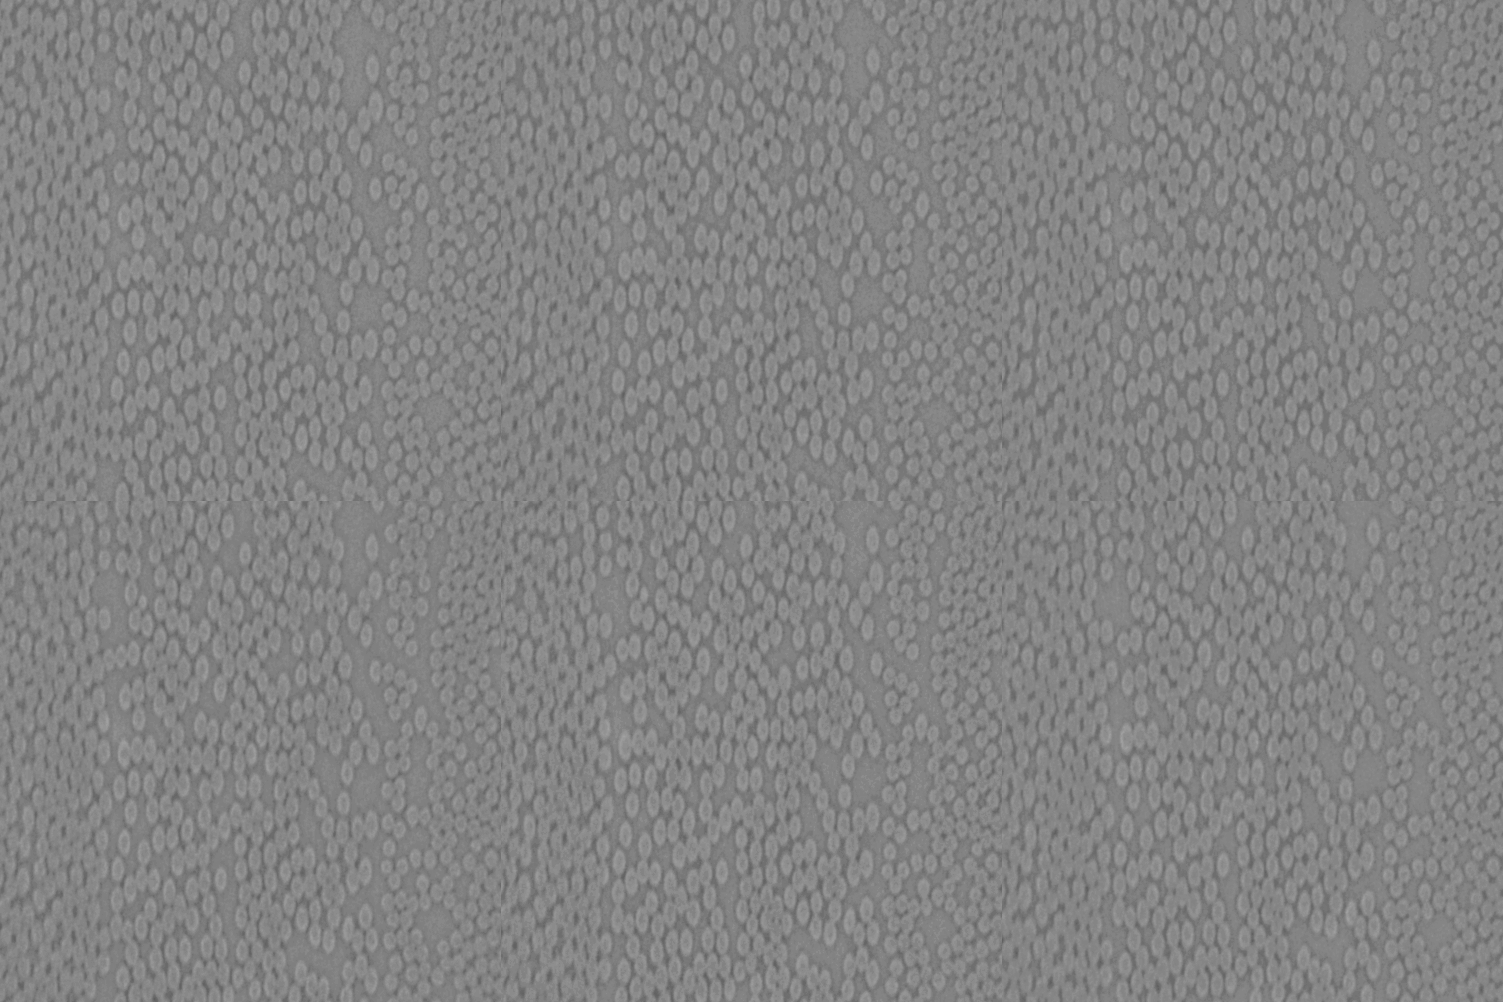
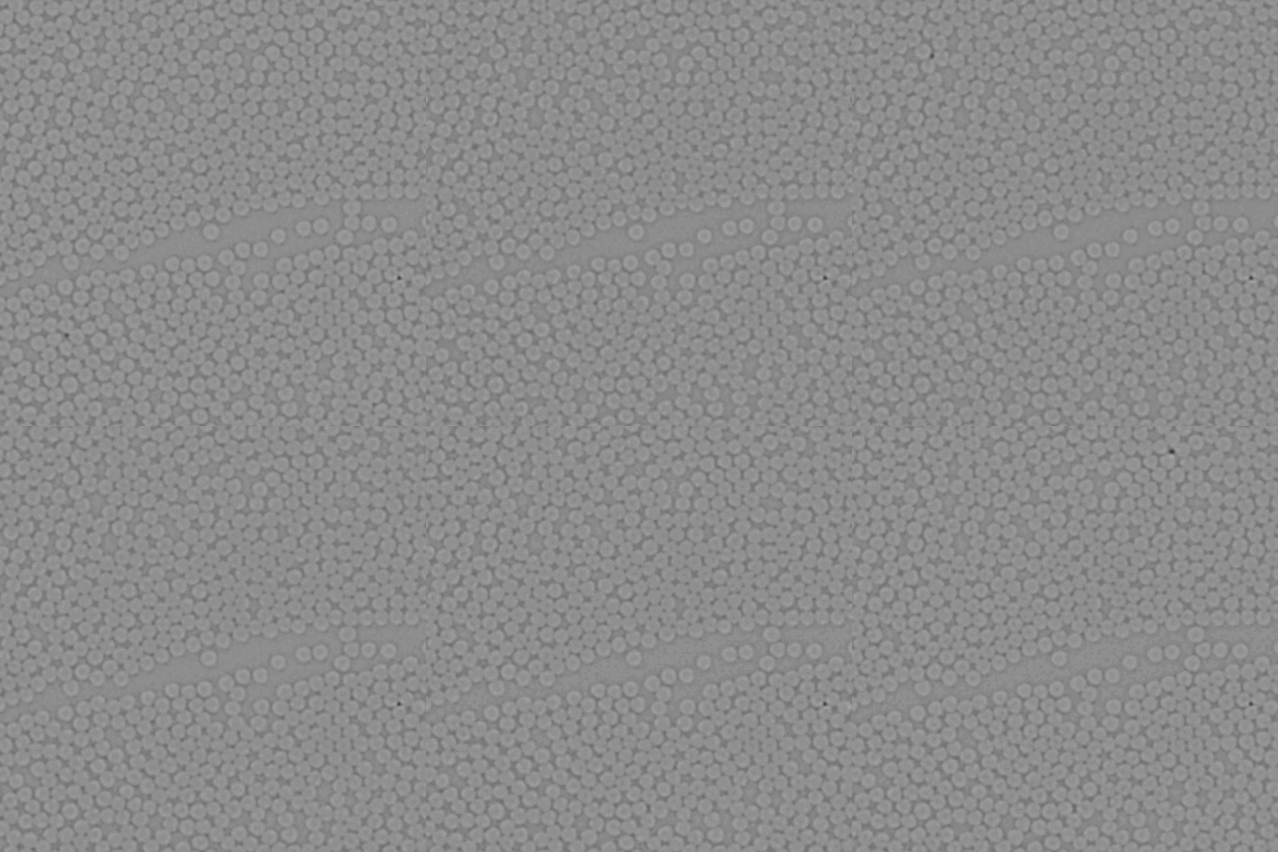
Using X-ray tomographic image stacks of a CFRC specimen (Figures 2 and 3) I have developed a machine learning algorithm that identifies the centers of carbon fibers at every position through the depth of the composite. The algorithm works by collecting image data of carbon fiber cross sections and using them as training data for a convolutional neural network (CNN).
- Quickly select centers of cross sections and using mouse
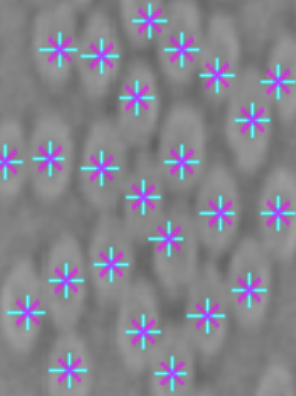
Figure 4. Manual selection of fiber centroids. - These points then fit a bounding box around each fiber. Any fine adjustments to the position, width, and height of each bounding box can be adjusted using the keyboard.
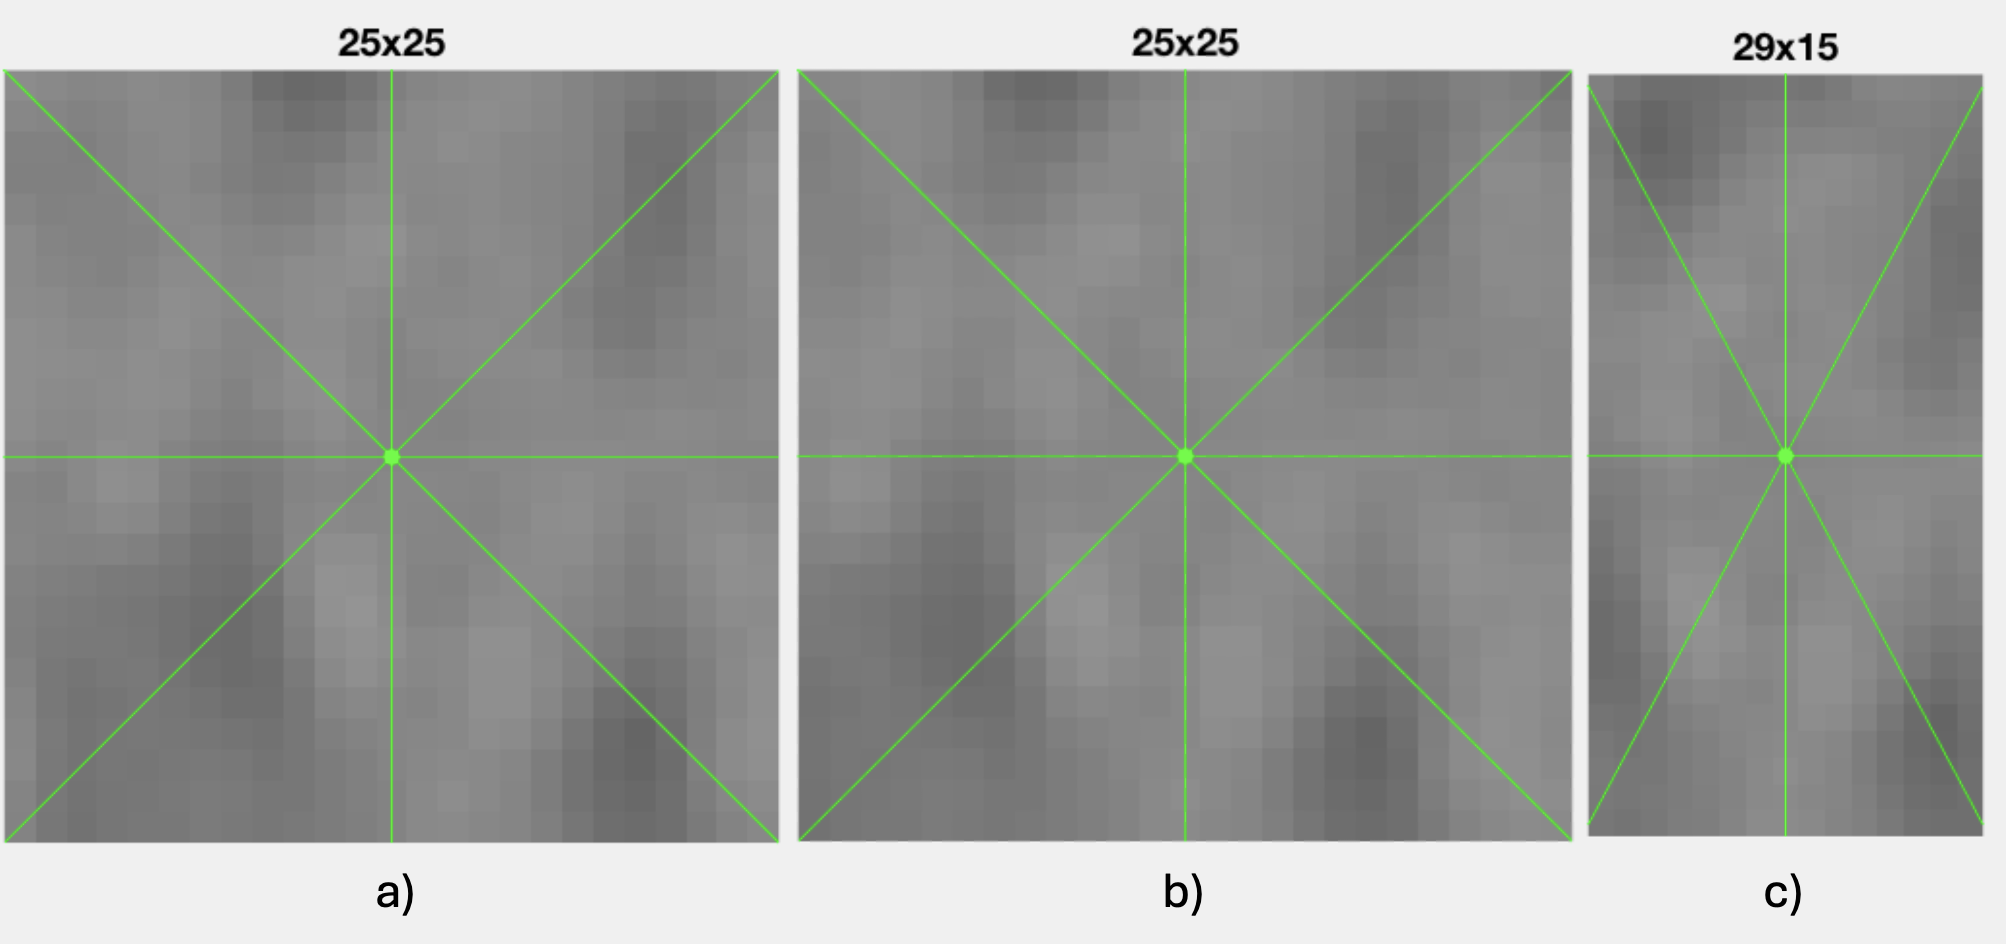
Figure 5. a) Original bounding box for a given fiber. b) Centered bounding box using arrow keys. c) Adjusted width and height to encapsulate fiber. - This adjustment process is repeated for each fiber. Then, the bounding box image data is exported with an associated label of "fiber".
- Then, all the bounding boxes that were not selected are exported with an associated label of "not-fiber".
The algorithm
Once data has been collected, a CNN is trained for each bounding box size that was collected. This CNN essentially classifies an image (with the same size of the bounding box it was trained on) as "fiber" or "not-fiber".
Sliding windows are then used on the test image to extract smaller images with sizes of the bounding box sizes. These images are inputted into the corresponding CNN (that was trained on the same size image). Each CNN then outputs a confidence map that contains the probability that each pixel in the original test image is a "fiber" with the corresponding bounding box size.
These probablities are averaged together. Then, I filter out any overlapping detections using non-maximum suppression (NMS).
Results
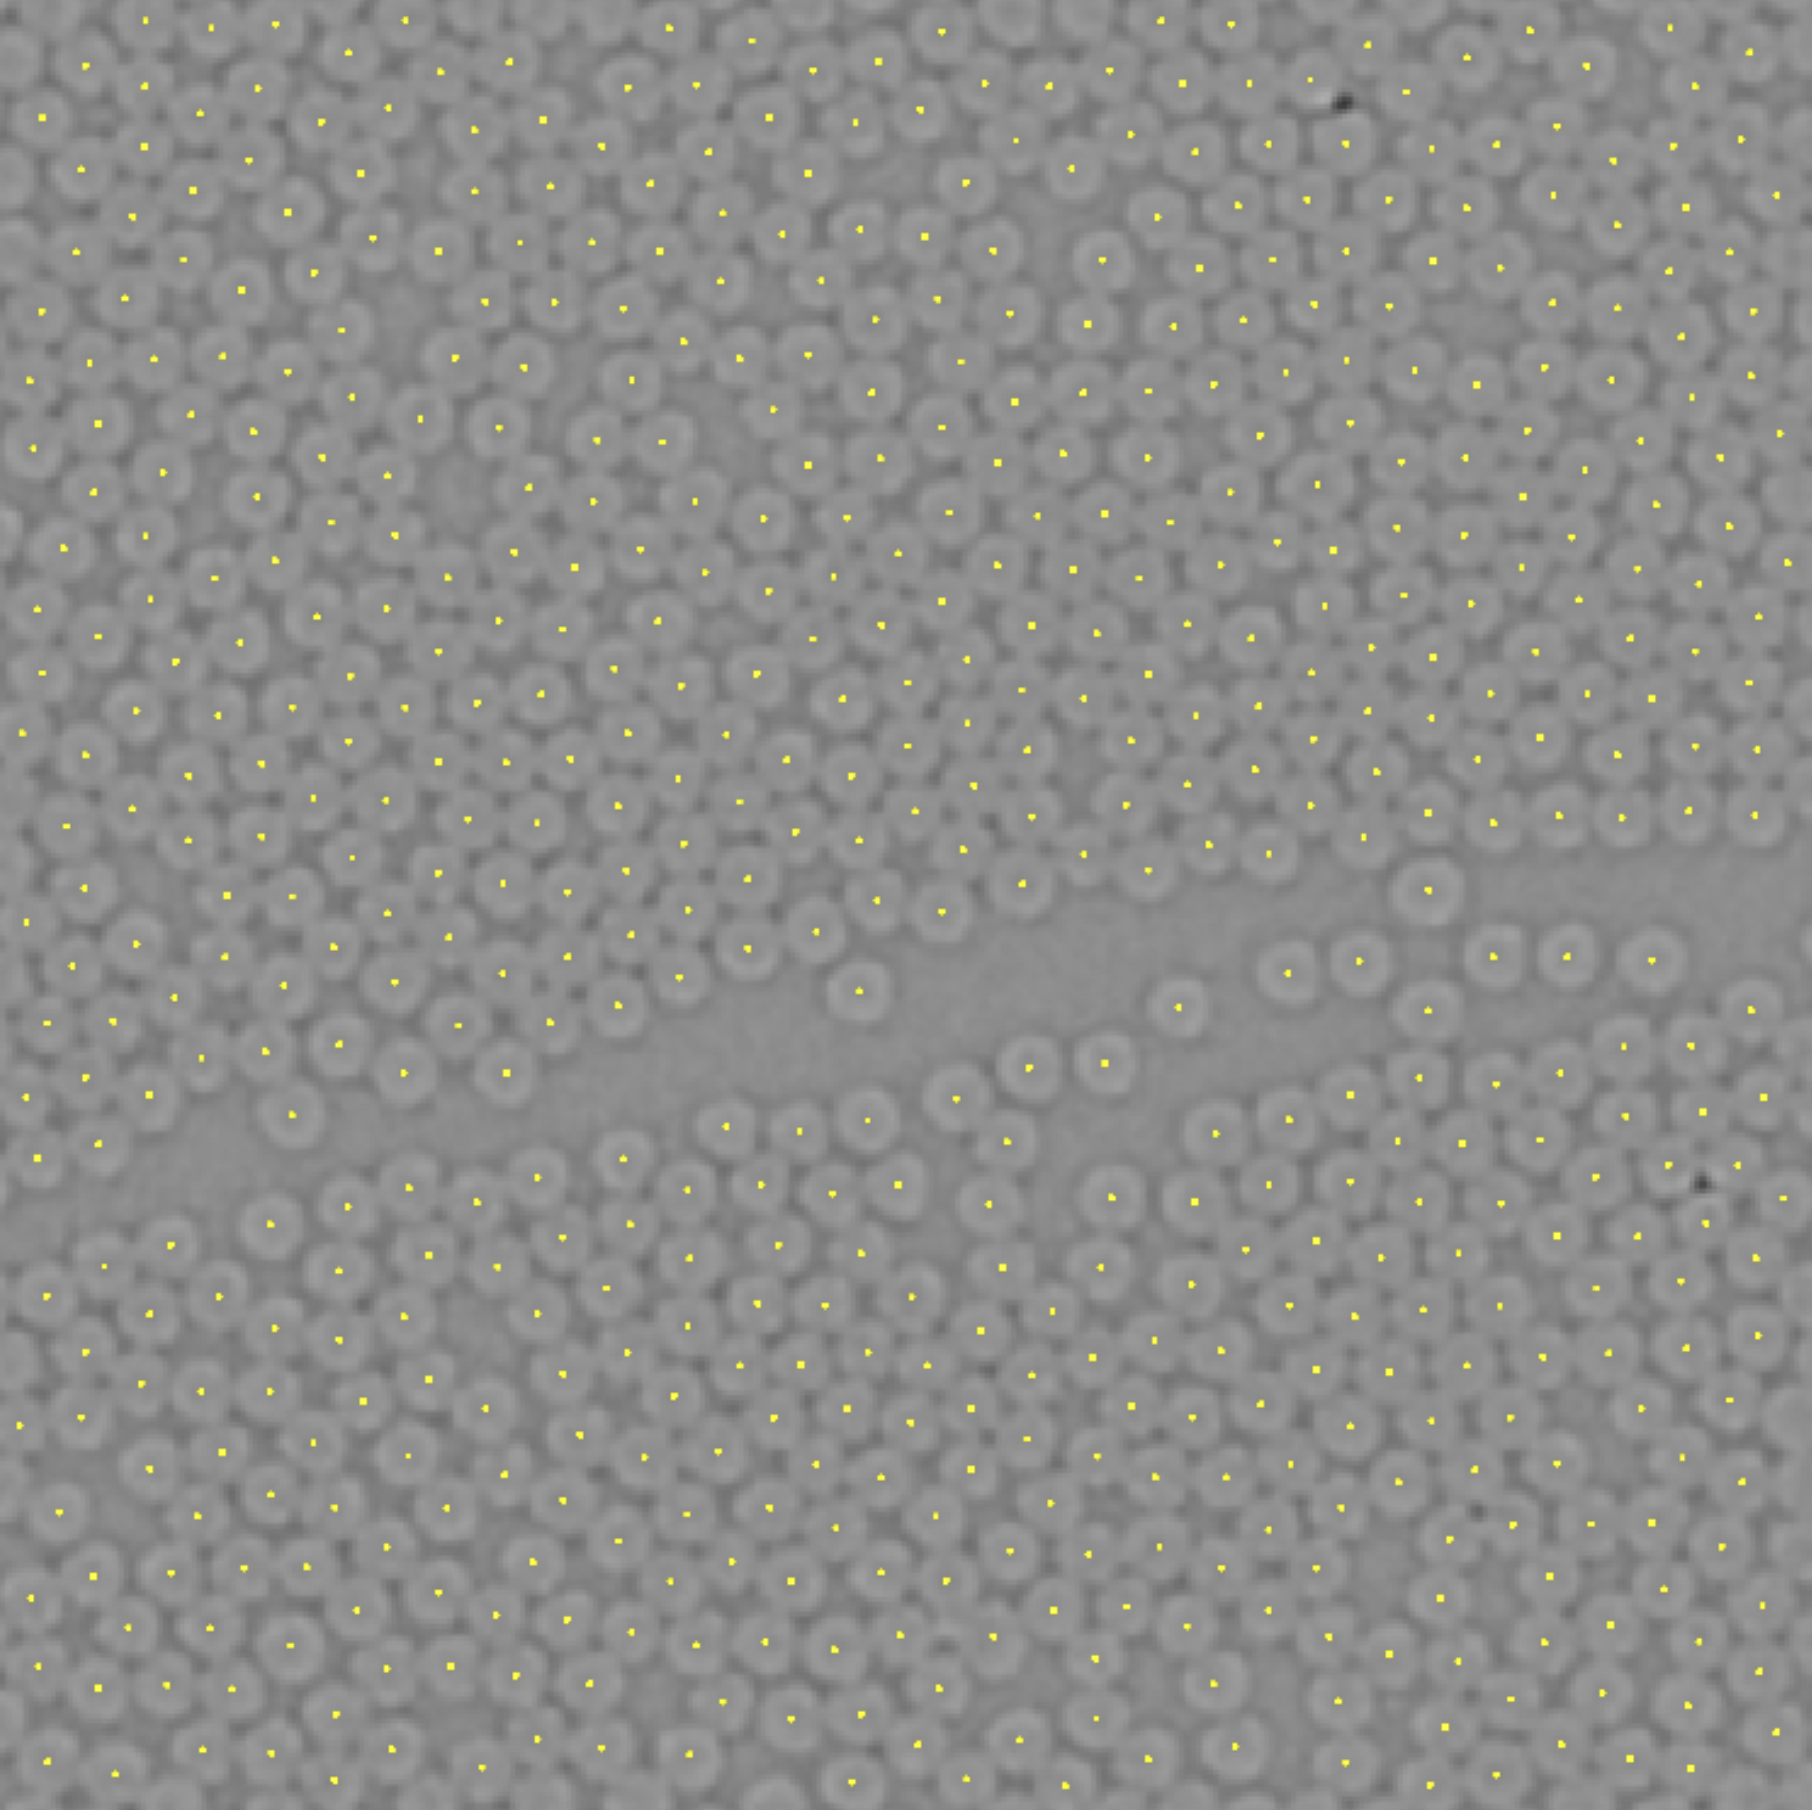
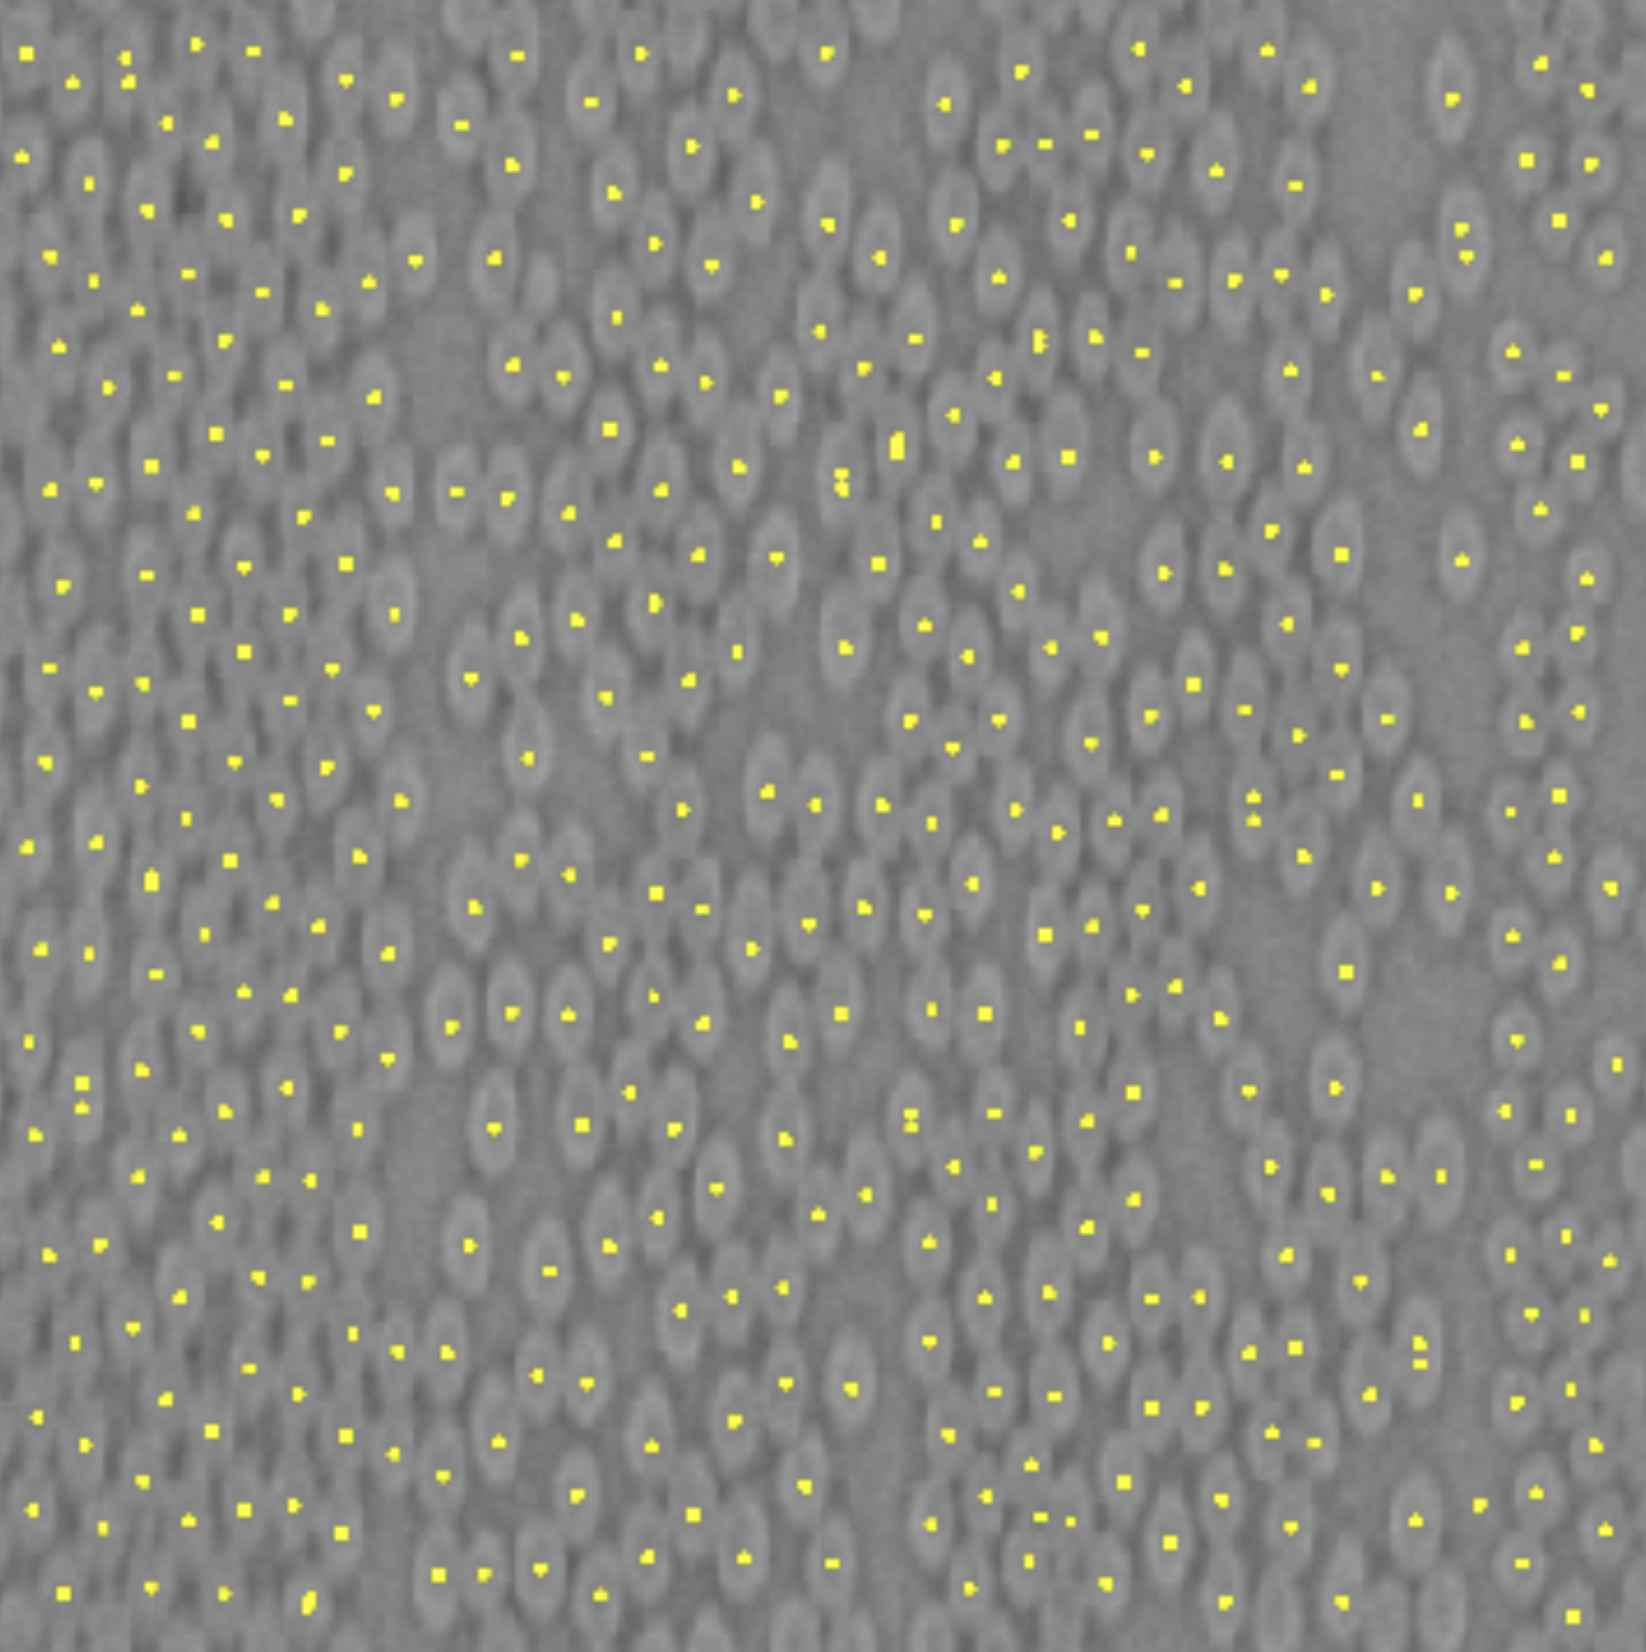
The algorithm I devised performed very well on extracting fiber centroids in both unidirectional and multidirectional CFRCs. The results for each are shown in Figure 6 and Figure 7.
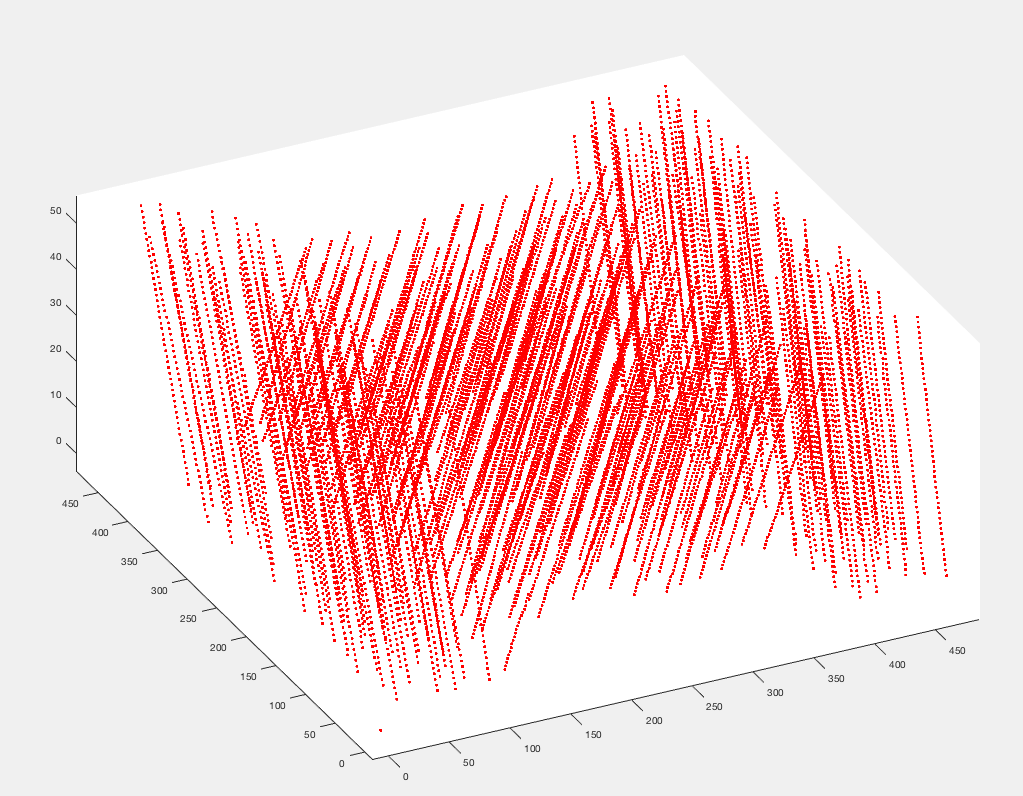
With accurate fiber detection, I segmented the entire CFRC image stack to obtain the three-dimensional structure of the fiber layout (Figure 8). Thus, this framework has shown to be effective in analyzing CFRC fiber structure.
